
Inspect the Dashboard
Choose DASHBOARD on Home to open /pro/dashboard. Use it to read the running experiment’s nodes and networks as tables, especially when a diagram is too crowded to compare addresses.
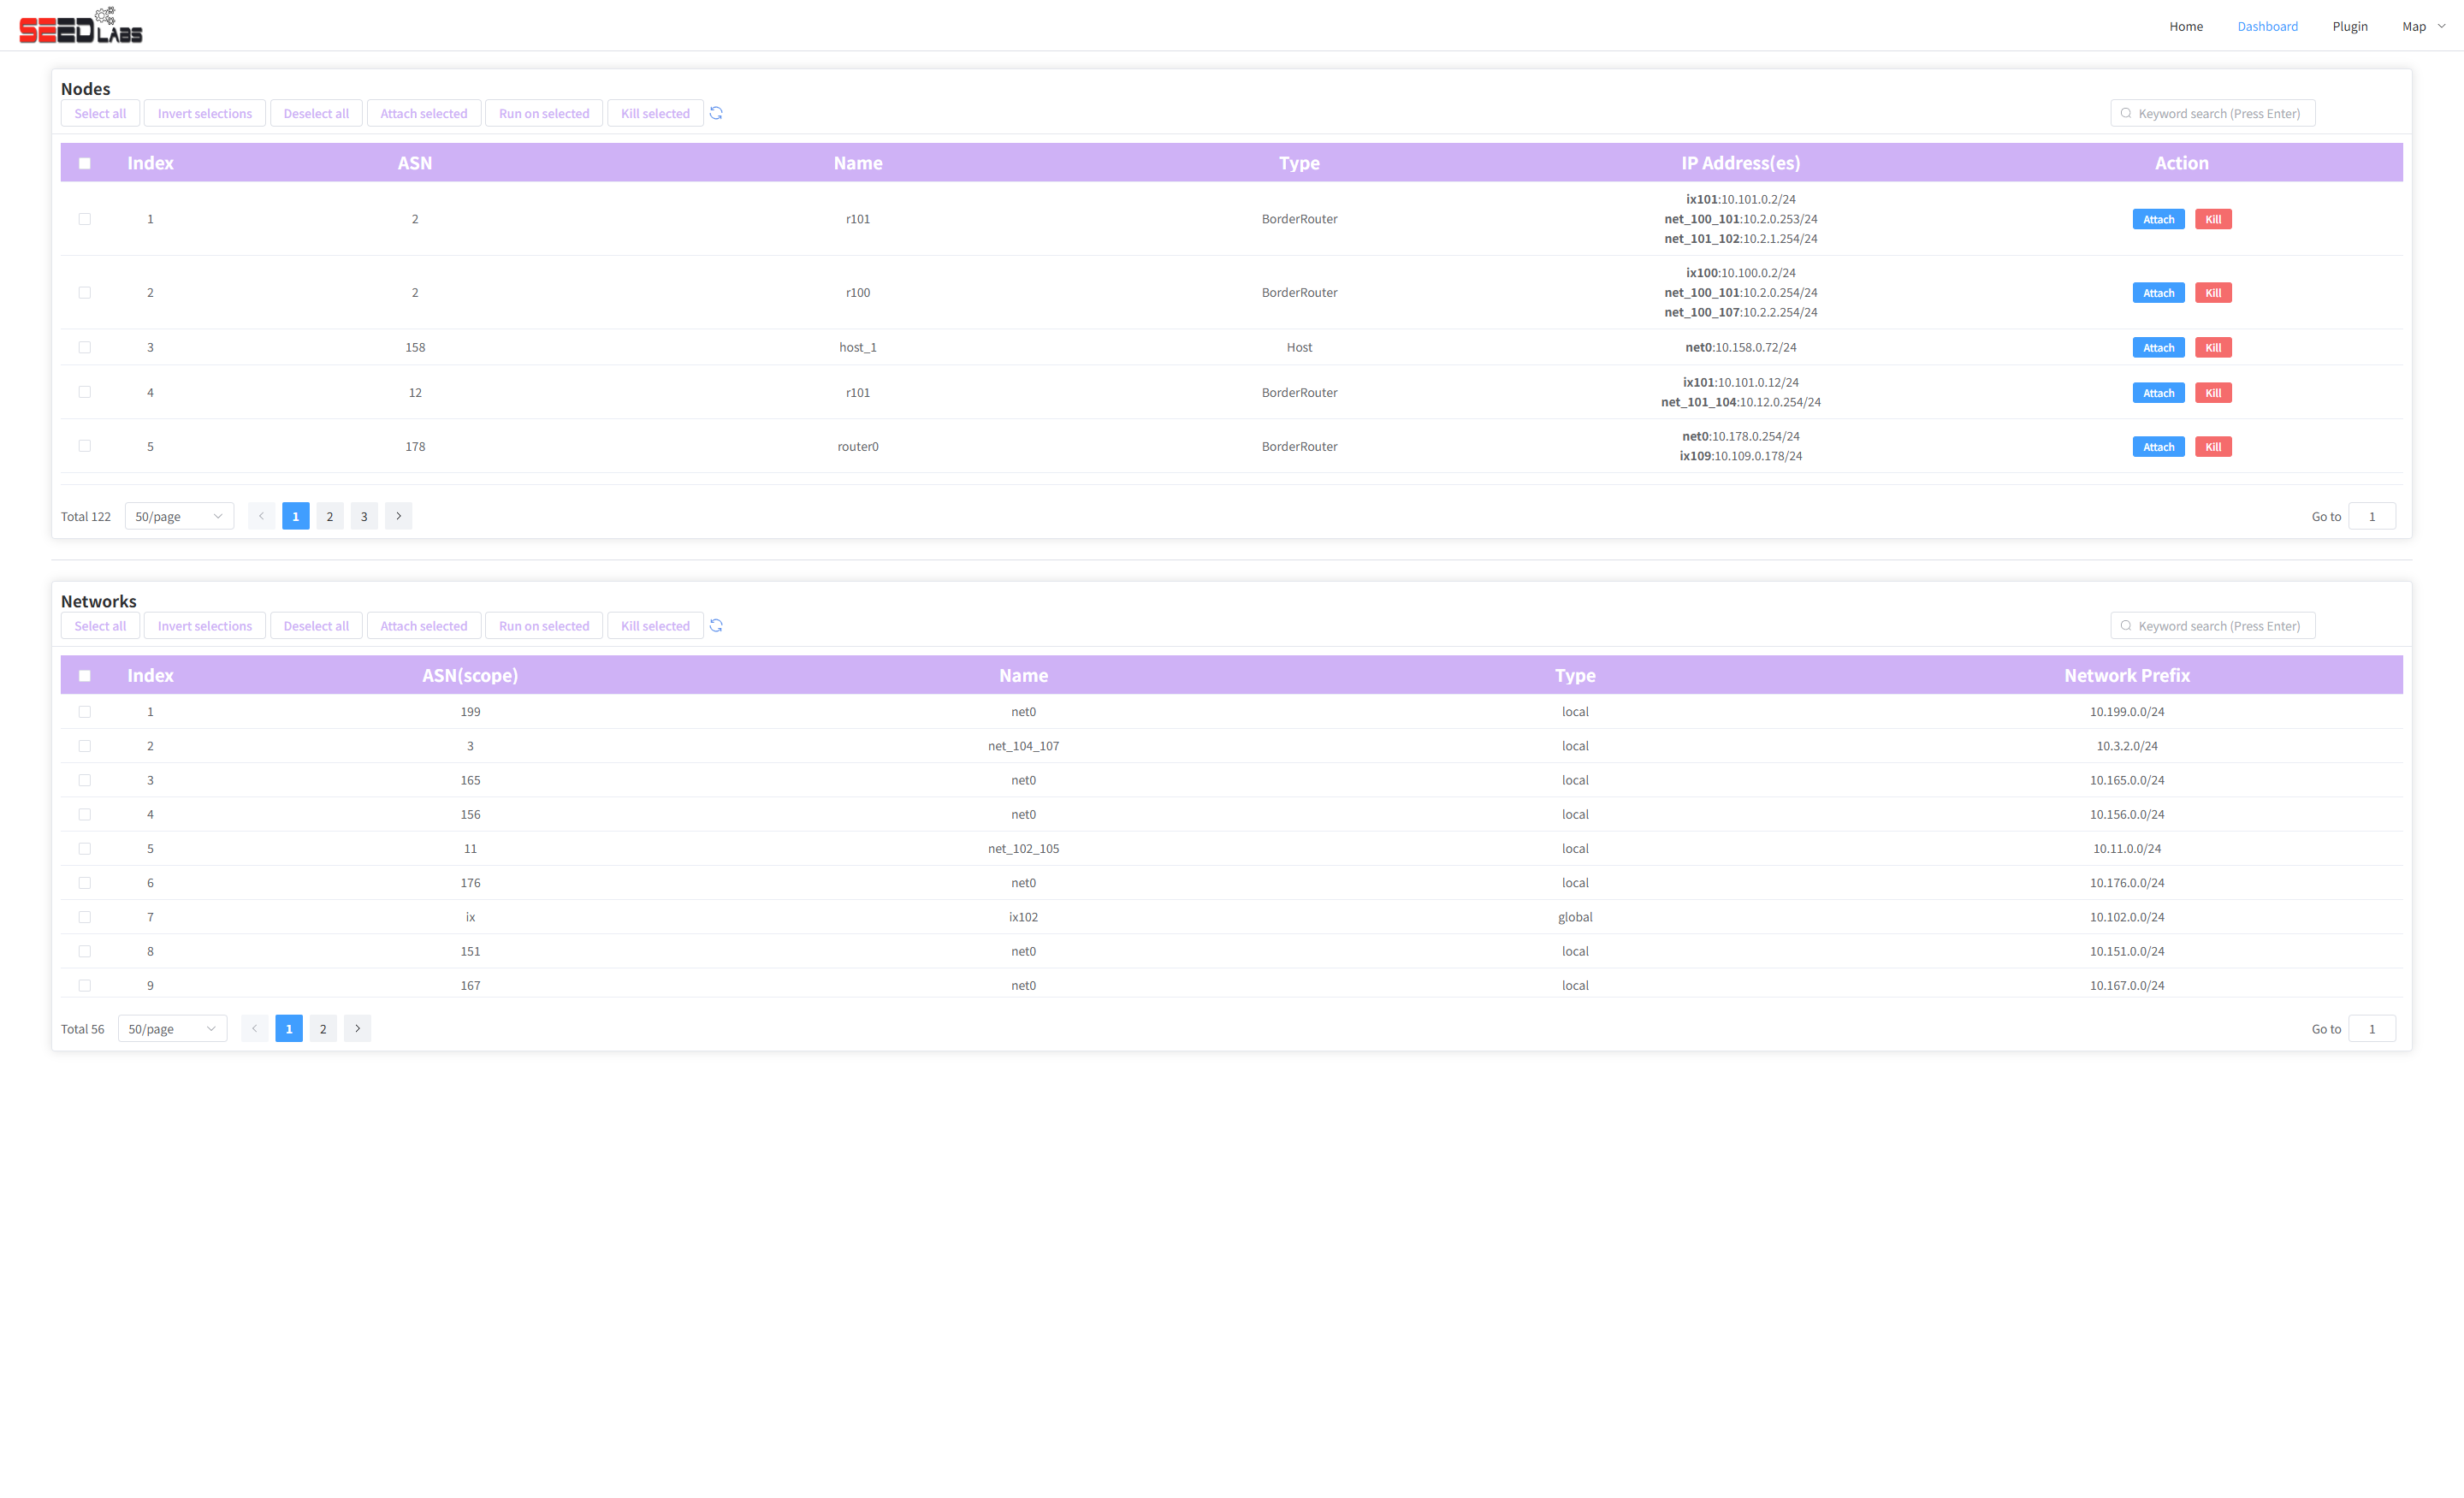
Read node information
- Locate the Nodes table.
- Compare each row’s ASN, Name, Type, and IP Address(es).
- Use the table’s page controls or page-size selector to see more rows.
- Use the refresh control to reload current information when the experiment changes.
Read network information
Find the Networks table and inspect the network name, scope, type, and prefix. Its pagination is separate from the Nodes table. A network prefix describes the address range; a node may have addresses on several networks.
Current interface limitations
In the current implementation, the Dashboard’s keyword-search action, selection / bulk-action toolbar, and row Attach / Kill actions are placeholders. They may appear on screen without performing the advertised action. Use this page for inspection and pagination.
To search for a node, use the map Search tab. To open a terminal or control a live node, use the map’s node details.
If the tables are empty or show a loading error, refresh once and ask whether the experiment is available. An uploaded topology does not populate this live Dashboard.